MARKET TRENDS REPORT
APRIL 2022
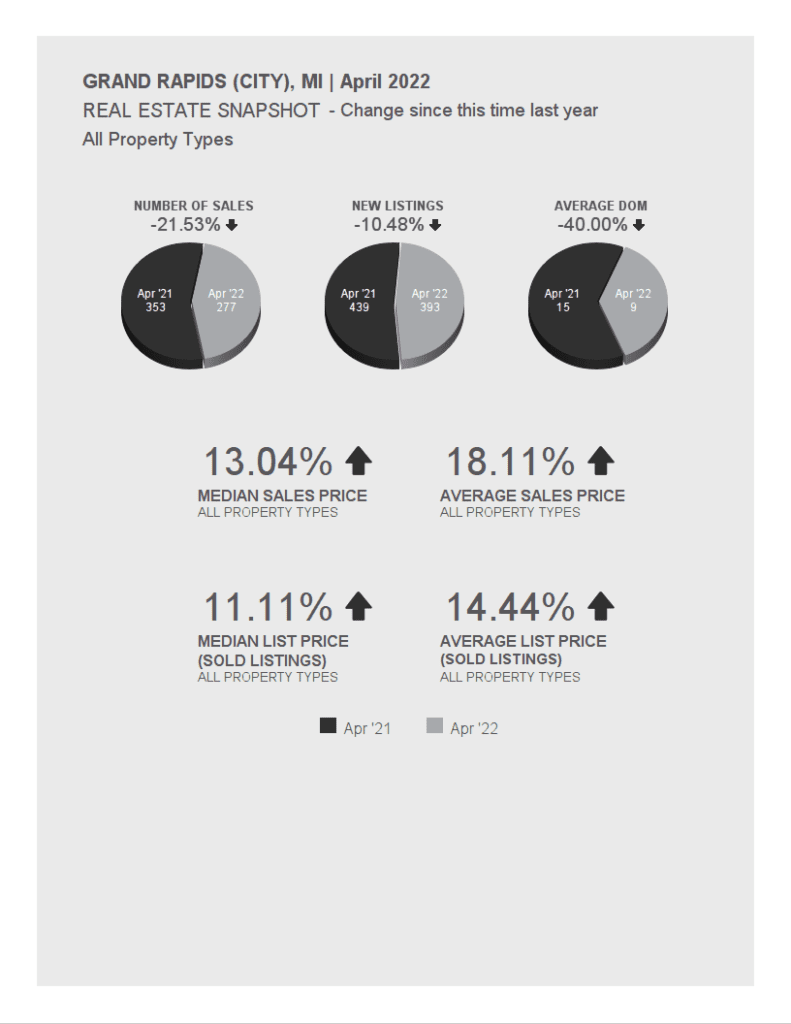
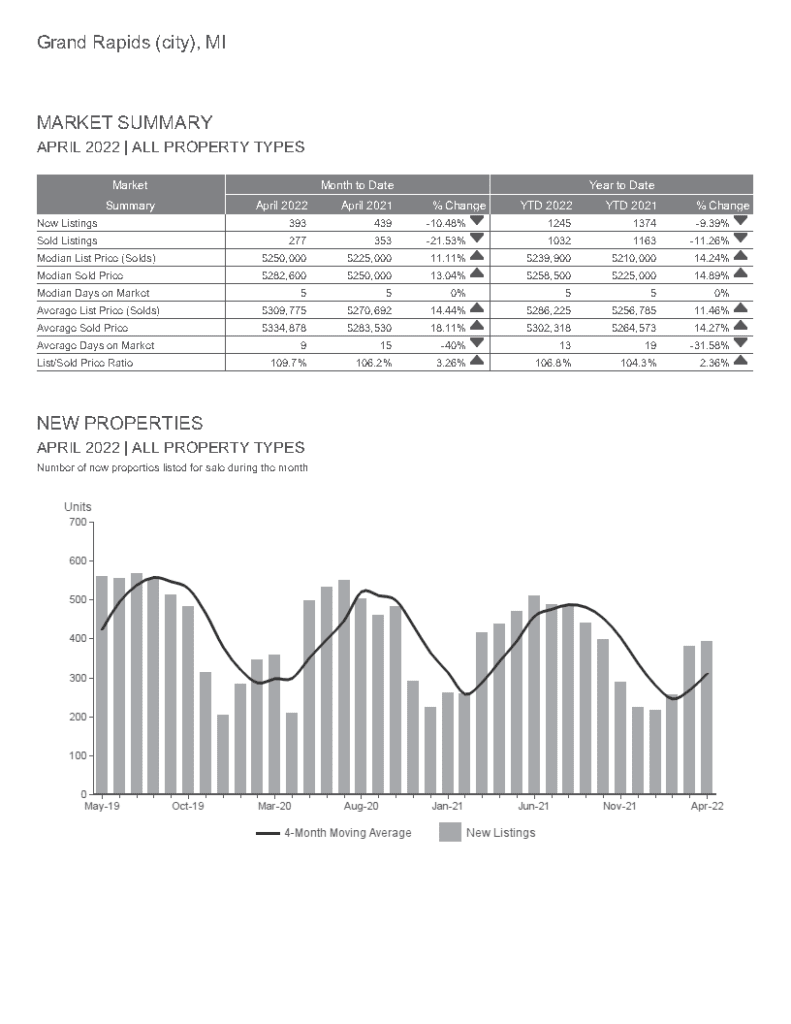
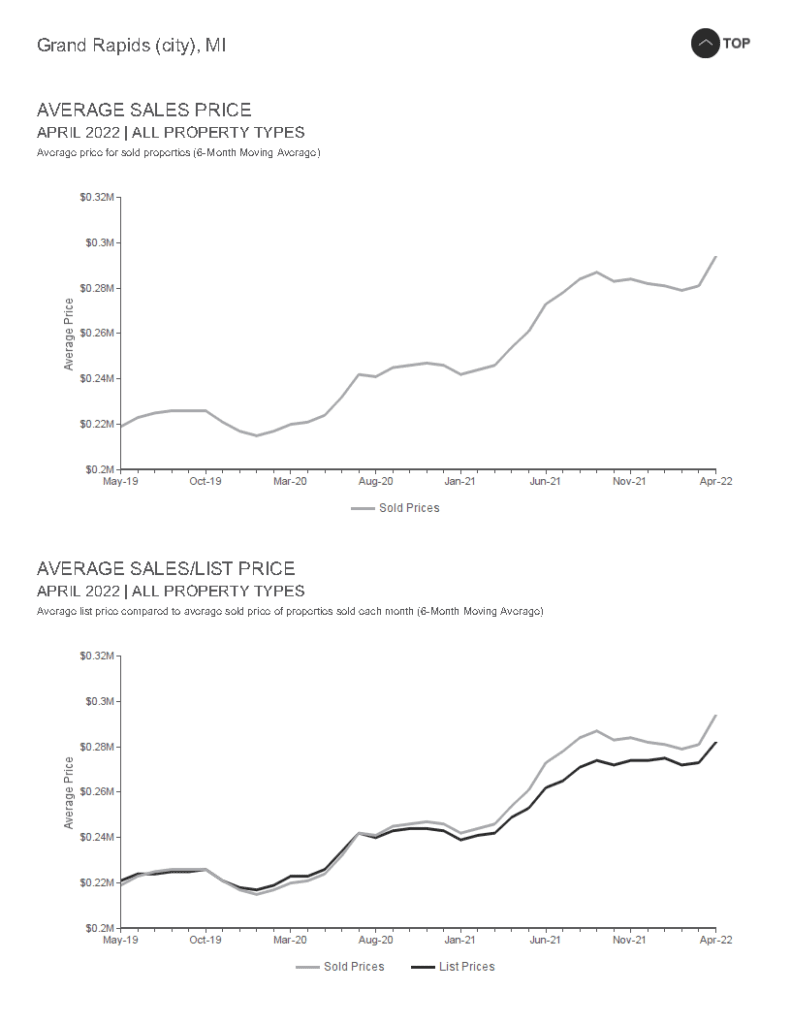
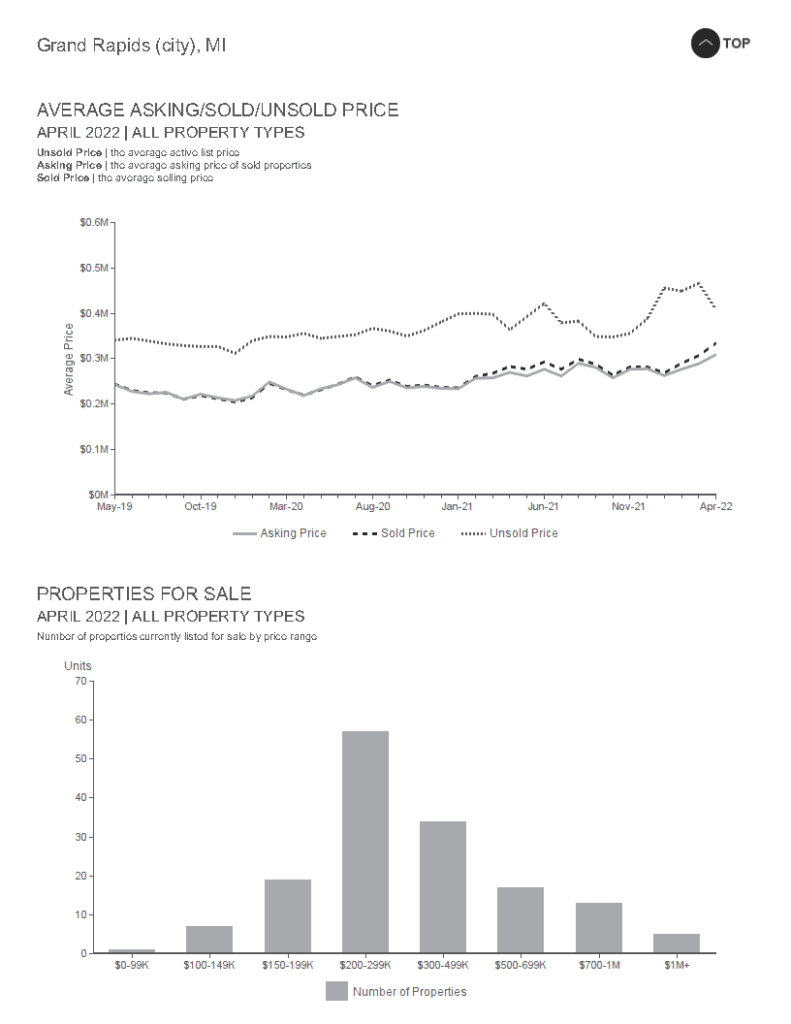
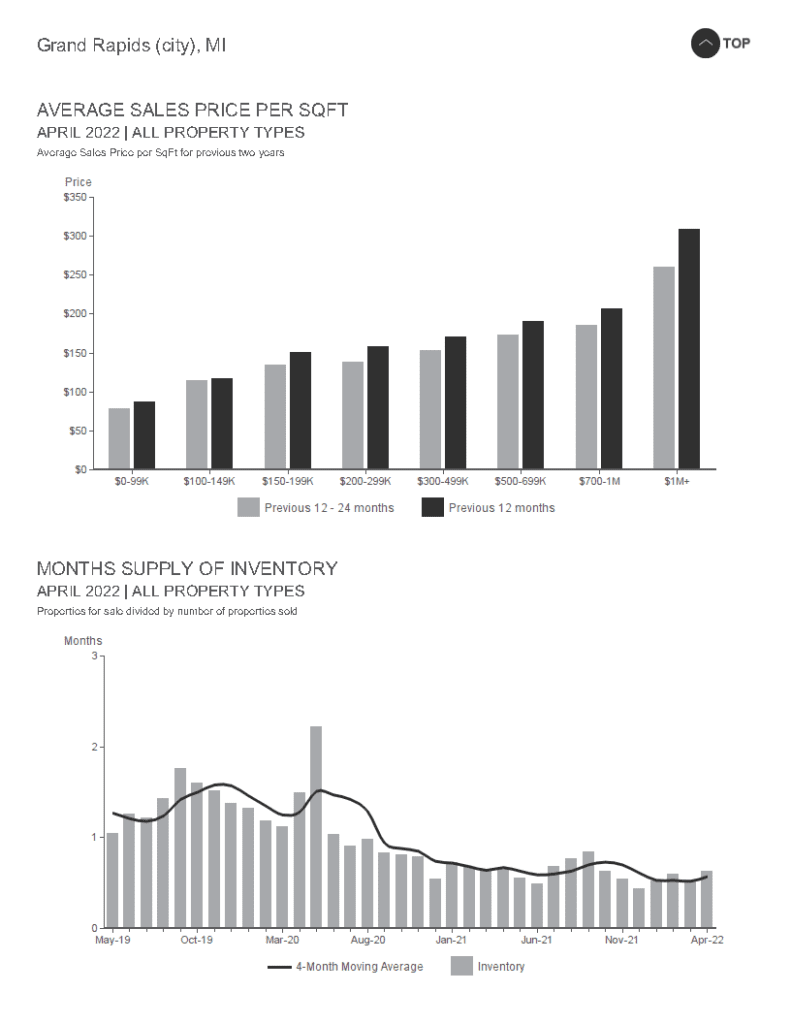
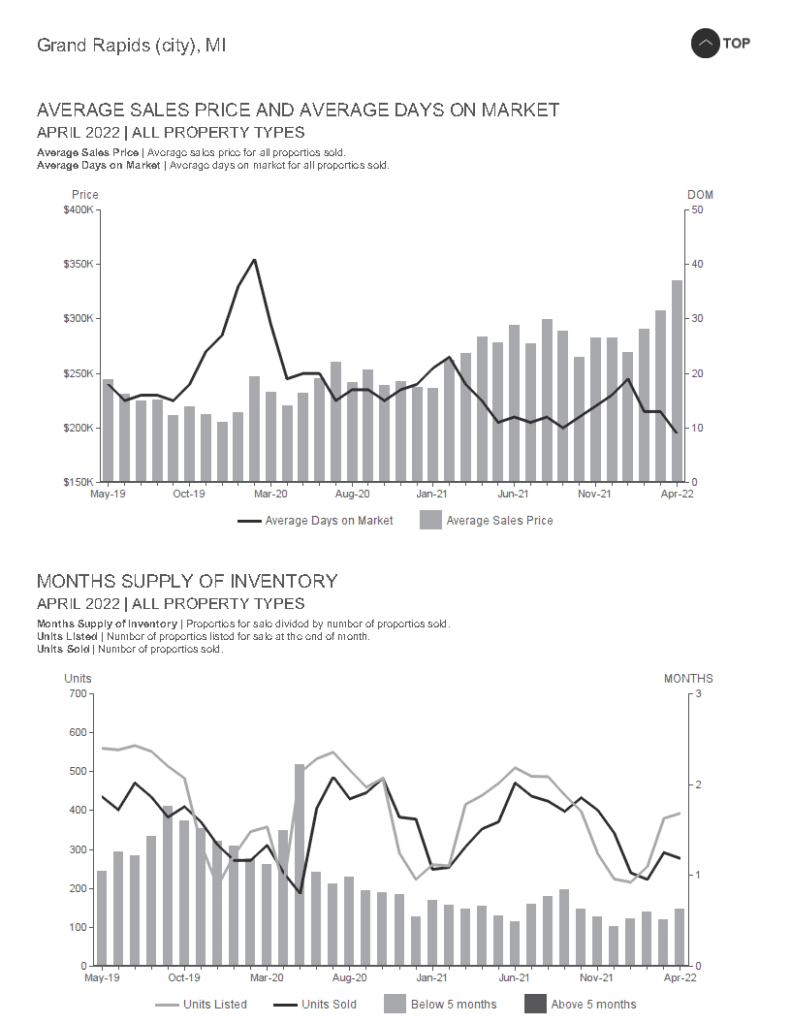
April brought in significant gains over April 2021. April 2022 Year-Over-Year SOLD price averaged 18.11% increase over 2021. The chart on page 4 is an excellent quick glance of how many new properties tend to list per month. Should the trend follow that of past years, we are headed into the time when we see the most number of listings on the market (April – June/July.) With the lower inventory, the market continues to have more buyer than sellers which continues to have the market trend toward a “seller’s” market. That is expected to continue however, the amount of choices for buyers is expected to increase. Daily we are seeing new houses hit the market (new inventory) and daily we see many new listings go under contract (pending.)
If you like numbers – this is a great report 🙂 If you want to hear more about how this impacts your house and your future plans to move – let’s go beyond what’s here and talk specifics!
Reach out – I am here to help 🙂
View the PDF report on this link to the right here: APRIL 2022 MARKET TRENDS REPORT
