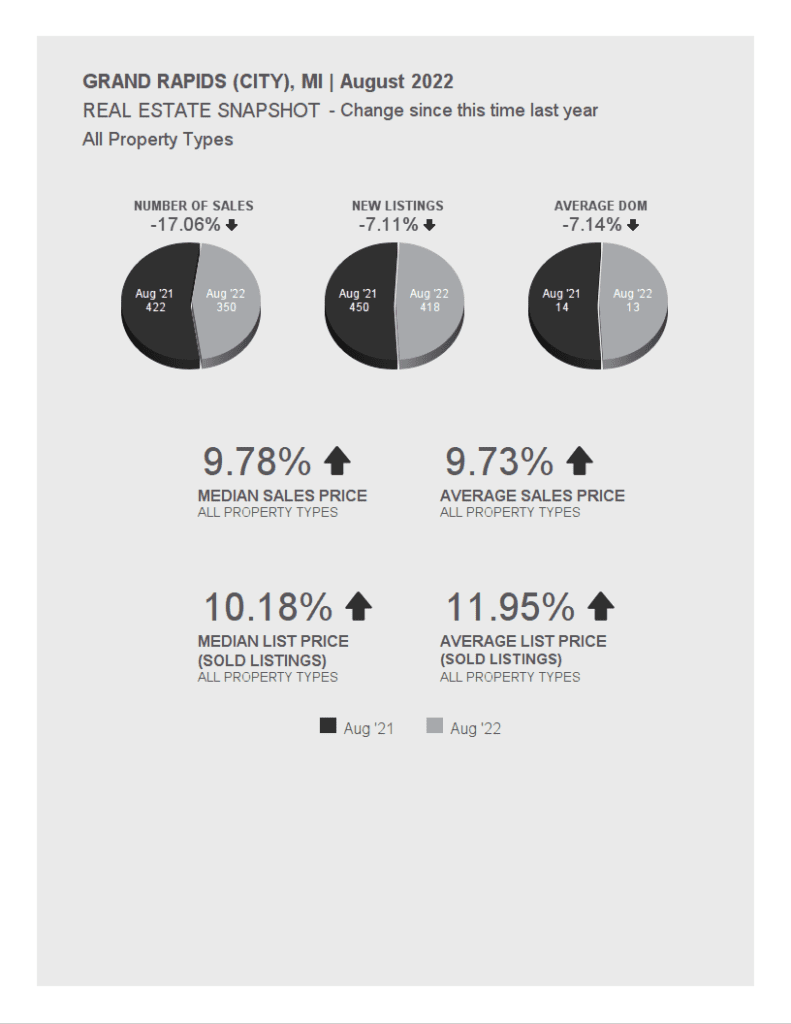
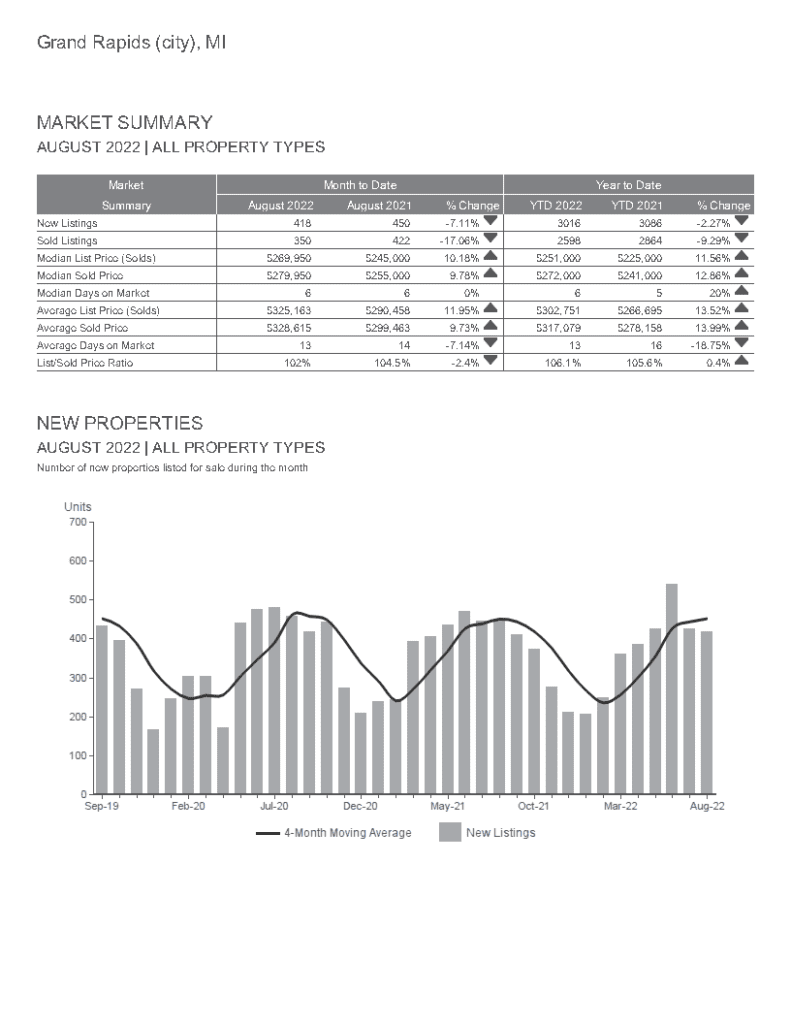
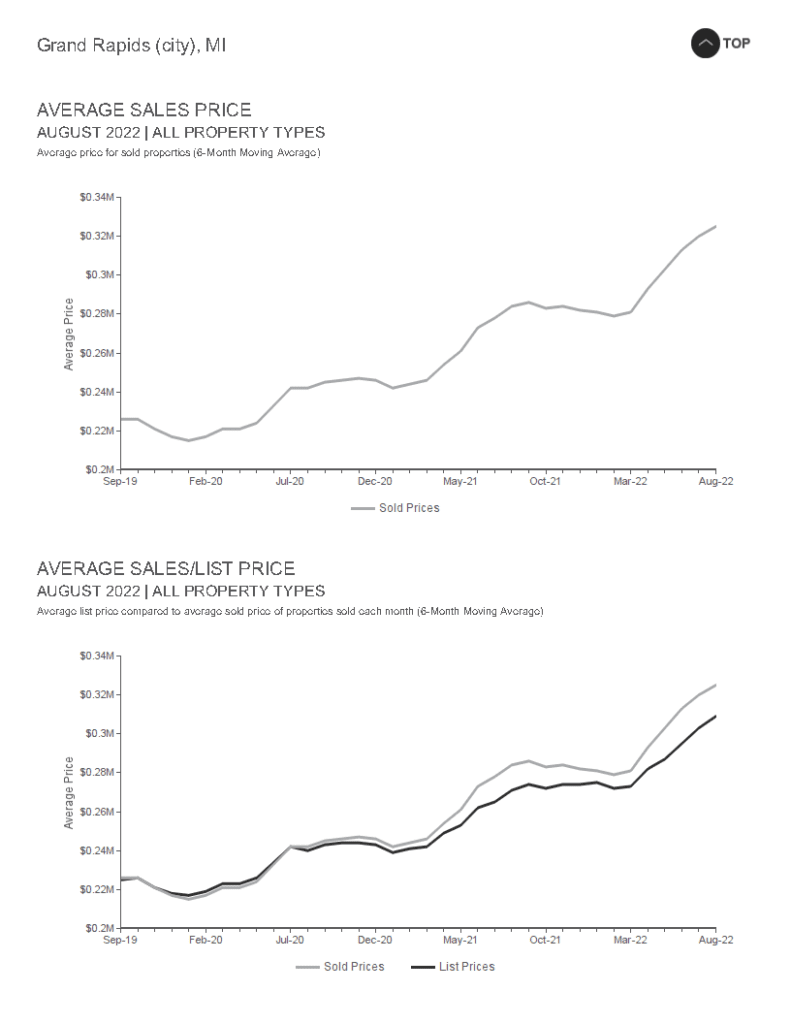
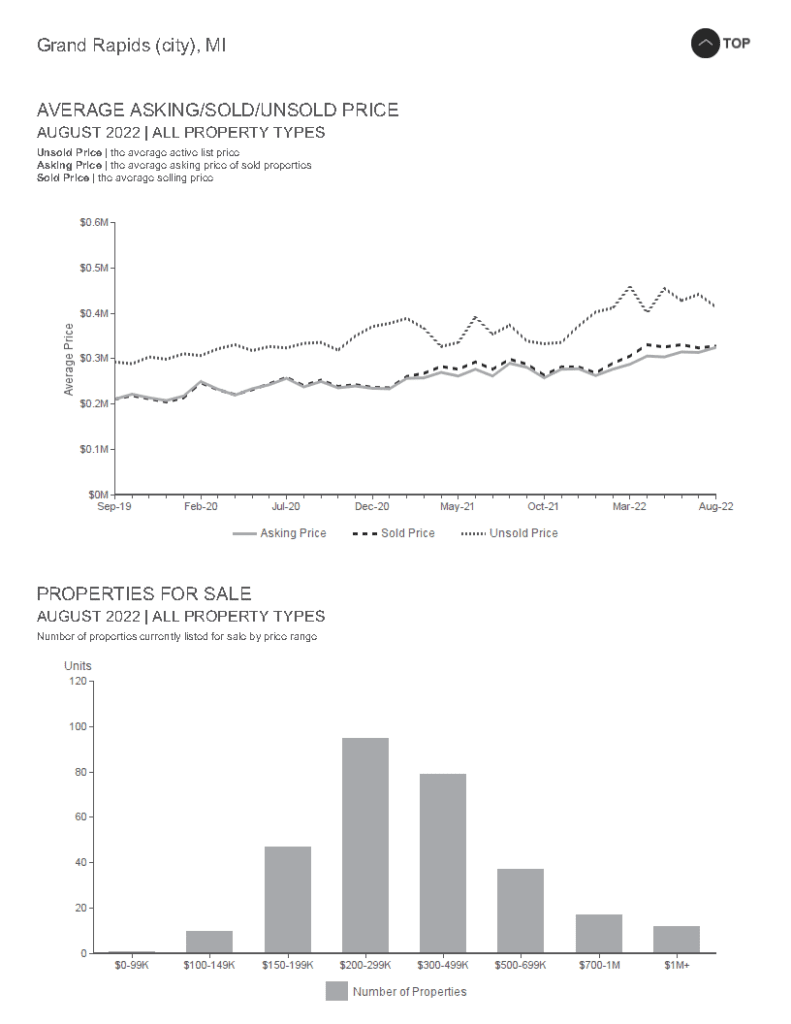
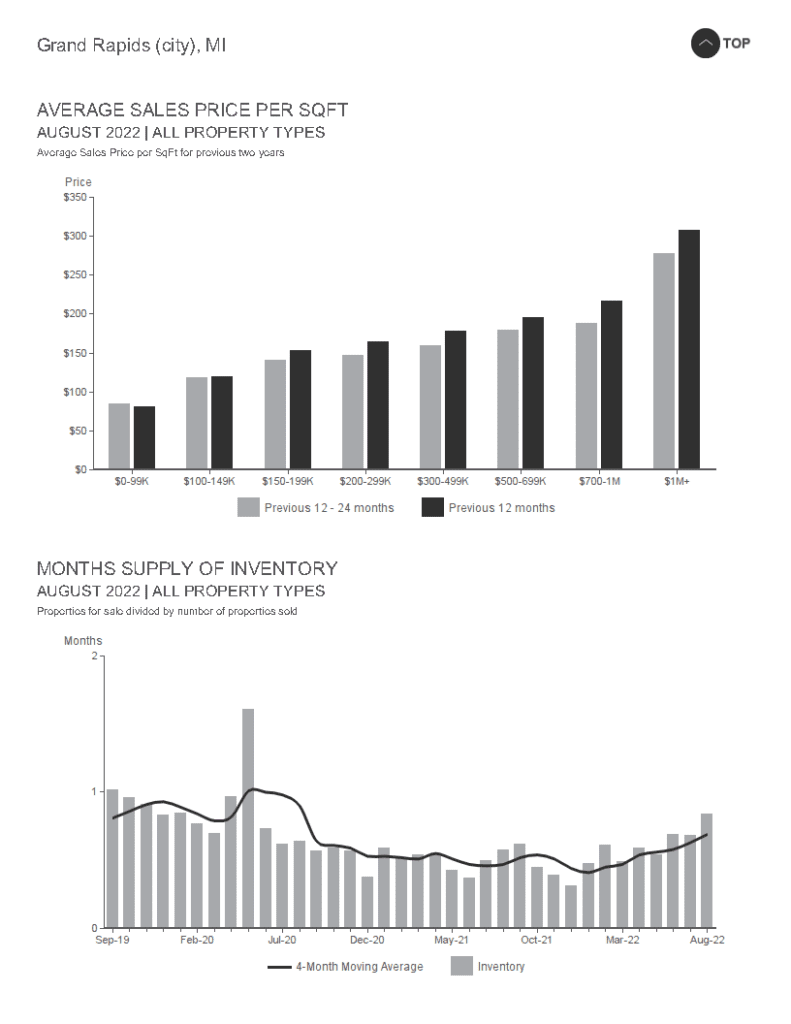
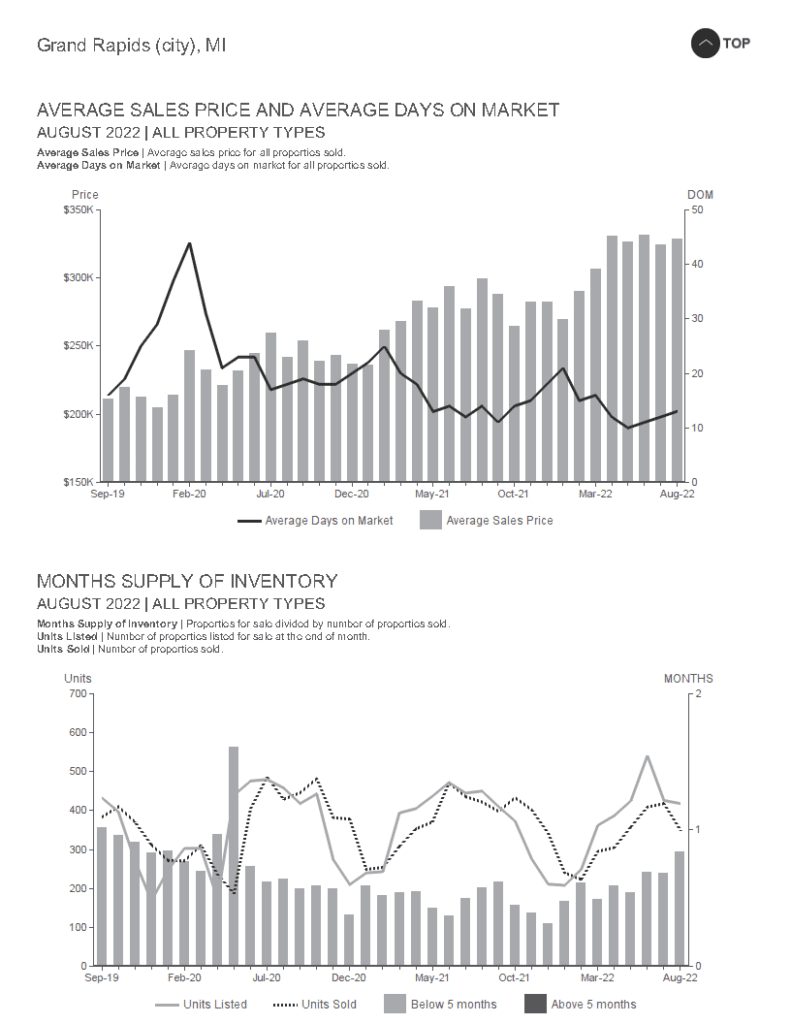
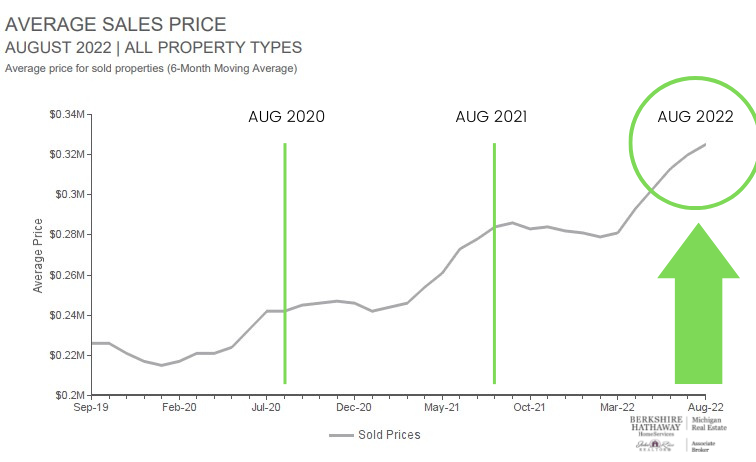
How does 2022 compare to 2021 or even 2020/2019? The latest Market Trends report shows this market by the numbers. One such chart to highlight is the average sales price chart through August (the latest 30 day numbers.) The trend continues to have sales prices increase in value over past years. As we talked about in previous post we are seeing a trend of deceleration vs depreciation. The west Michigan market continues to be a sellers’ market and continues to show good appreciation.
https://www.bhhsmichiganrealestate.com/mce/prj/bmi/history/MT/2022-08/MT_342_426738_1349_160931.htm
